


Hometown Hero: UL Solutions Goes Public


Introduction
UL Solutions, Inc. offers testing, inspection, and certification services, along with energy efficiency, indoor air quality, and wireless services. It operates through two complementary businesses: TIC (industrial and consumer segments) providing comprehensive testing, inspection, and certification, and E&A offering subscription-based software and advisory services for risk management, sustainability, and compliance. The company serves a wide range of end markets with its diverse service offerings. UL Solutions was founded in 1893 and is currently headquartered in Northbrook, IL.
UL Solutions is currently listed on the NYSE, with the ticker of $ULS. Their current market capitalization is approximately $8.2 billion. Although they are classified under the industrials sector, they are not specifically mentioned within one industry but generally fall under Business Support Services or Consulting Services.
Fundamental Analysis
- Financial Performance:
UL is brand new to the spotlight since it became public in April 2024. According to its 10Q, “On April 16, 2024, after the quarter end, the Company completed its initial public offering of an aggregate of 38,870,000 shares of Class A common stock (the “IPO”) by UL Standards & Engagement at a price to the public of $ 28.00 per share.” We will analyze UL financial data since 2021. UL financials seem to be relatively steady since 2021, with little change or growth. Revenue has been around $2.5B and gross profit has been roughly $1.2B in each year since 2021. Net income peaked in 2022 at around $293M and slightly dropped to $260M in 2023. Most key financial metrics and ratios have been stable since 2021, except long-term solvency. Long-term solvency is the company's ability to meet long-term obligations and sustain operations into the future. UL’s total debt-to-equity ratio was 61.3% in 2022 and grew to 156.8% in 2023. UL’s long-term debt increased by $405M from 2022 to 2023, causing retained earnings to decrease from $211M in 2022 to $24M in 2023. This drives the ratio up significantly because of the increase in total debt in the numerator, and the decrease in retained earnings also decreases total equity, which is the denominator. This may be a scary sight for investors and unfortunately, with UL being a newly public company, it is hard to pinpoint what exactly they are using these funds for. UL is likely using the funds for research and/or upgrades in PPE, considering the type of services they provide, but it is hard to know. UL’s Altman z-score was 1.58 in 2023 which falls below the generally accepted threshold of 3. Altman's z-score helps us evaluate the risk of UL going bankrupt within two years. Although this number is lower than preferred, we are not too concerned due to UL’s market position and long-standing history.
- Valuation Metrics:
UL offers quarterly dividends to investors of $0.125 per share. Its current dividend yield is 1.2%. UL’s TTM P/E ratio is 32.34 and its EPS is $1.30. There are not many publicly traded large TIC companies in the United States. UL’s biggest publicly traded competitors are SGS, Bureau Vistas, and Intertek. None of these companies are traded in U.S. markets. As displayed in the chart below, UL’s EPS falls short of SGS and Intertek and UL’s PE ratio is slightly higher as well.

- Market Position:
UL is the market leader in the North American testing, inspection, and certification (TIC) industry. However, they face international competition from companies such as SGS, Bureau Vistas, and Intertek. The TIC industry is appealing to investors and is resilient to market volatility and uncertain events. According to Yizhi Long, an associate at Bryan, Garner, & Co. “Despite the havoc wreaked by the Covid-19 pandemic across various sectors, major listed TIC companies emerged as beacons of resilience in 2020. Remarkably, these companies maintained a relatively stable EBITDA margin despite experiencing a dip in revenue. This steadfastness serves as a testament to their adaptability in the face of unexpected hurdles and their prowess in responding to market shifts (Long, 2023).” Even in uncertain times, TIC companies have proven to generate relatively stable returns for investors. UL is well known in North America but is not a main competitor in the European and Asian markets. There is an opportunity for UL to tap into those markets since they already have the infrastructure for it. UL has offices and labs all over the world. As with most industries, different regions have different regulations, making it difficult to navigate new areas. UL has formed strategic alliances with China Certification and Inspection Group, Suzhou Academy, and Sumec Group. These firms are all based in China, meaning that UL is likely looking to strengthen its presence in the Chinese market.
Technical Analysis
- Price Trends:
As UL Solutions IPO’d less than 3 months ago, there is very little price chart data to be shown. Since then, their stock has climbed approximately 20%, proving that their original public valuation was undervalued. Another notable metric to mention is their dividend yield, which is currently set at 1.2%, or $0.125 per share.
- Relative Performance:
When diving into the industry, we can find some of UL’s competitors, categorized under Research and Consulting Services. Some of the top competitors mentioned are CACI International, Parsons Corp., and KBR, Inc. All of these companies have similar, but slightly larger market capitalizations than ULS. UL Solutions offers the highest dividend rate among these, sitting at approximately 1.2%, the next highest being KBR at .94%.
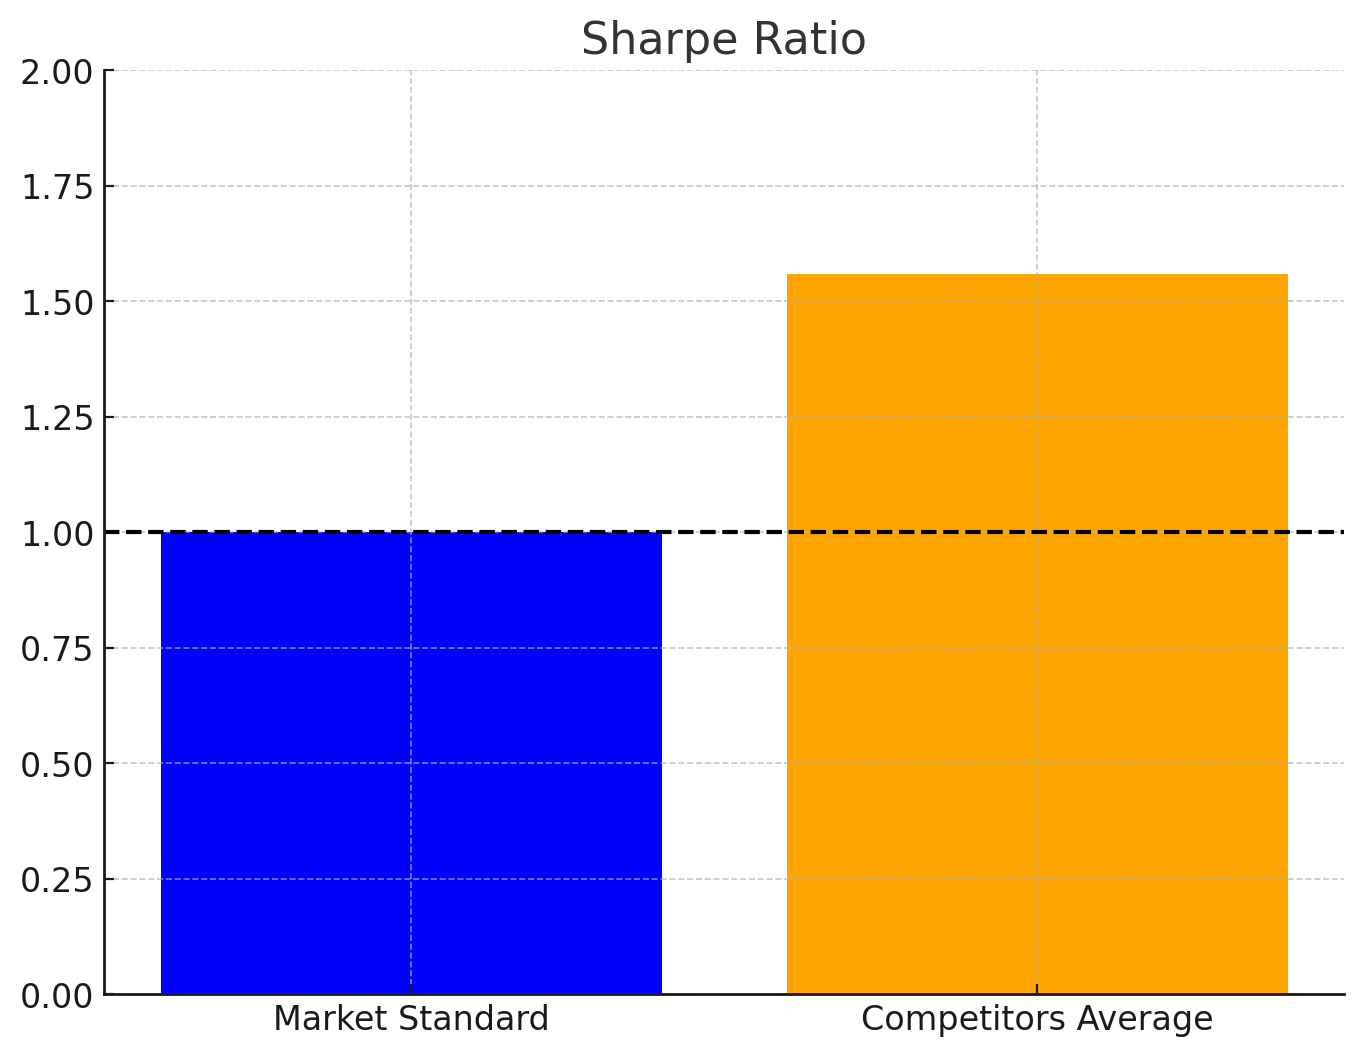
The average Sharpe Ratio among these 3 competitors is about 1.56, and the average Sortino Ratio is 2.65. This shows that generally, this industry can provide relatively high risk-adjusted returns, especially when upward volatility is removed from the equation, as seen by the higher Sortino Ratio.

- Chart Analysis:
Since Parsons Corp. IPO’d in 2019, all 3 of these ‘competitor’ companies mentioned have provided a return of 110%+ each, a hefty return for such a short period of time. Moving forward, ULS is likely to be involved in this growth, as they still provide a unique service within the industry, as well as paying the highest dividend, encouraging investment in their company rather than the competitors.

Conclusion
Based on our analysis, UL Solutions presents a bullish outlook. The fundamental analysis highlights stable financial performance, despite concerns over increasing long-term debt and a lower Altman Z-score. The company's strong market position in North America and strategic alliances in China indicate growth potential. Additionally, the recent IPO performance and attractive dividend yield suggest positive investor sentiment and future growth prospects.
This article is for informational purposes only and does not constitute financial advice; we are not liable for any investment risks, and readers should invest at their own discretion as we are not financial advisors and may or may not own shares in this company.
Long, Y. (2023, August 29). The steady growth and resilience of the TIC sector: Exploring future trends and investment opportunities. Bryan, Garnier & Co. https://www.bryangarnier.com/the-steady-growth-and-resilience-of-the-tic-sector-exploring-future-trends-and-investment-opportunities/
Yahoo! (2024, May 22). UL Solutions Announces quarterly dividend. Yahoo! Finance. https://finance.yahoo.com/news/ul-solutions-announces-quarterly-dividend-201500474.html
Yahoo Finance used for market price data
CapIQ used for fundamental data
Tradingview used for price charts
PortfolioLabs used for technical ratios
 | A guest post by
|